Understanding YOLOv2 training output
I was recently asked what the different parameters mean you see logged to your terminal while training and how we should interpret these. An interesting question I will try to explain here.
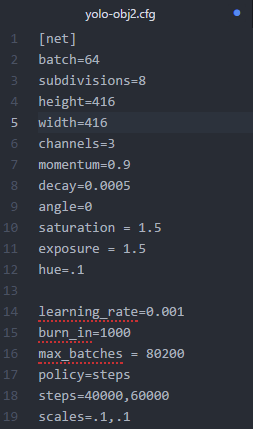
Nothing more relevant to discuss than a real life example of a model I am currently training. For reference, here's the .cfg file I used while training:
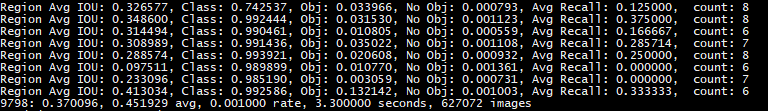
Next, a screenshot of the terminal output I am currently seeing:
This entire iteration/block represents one batch of images, divided according to our subdivisions. Have a look at the .cfg file I provided earlier to verify that batch = 64 and subdivision = 8. Looking at the image above, the training iteration has 8 groups of 8 images, reflecting these specific settings.
Batch output
Let's have a look at following line first, we'll break it down step by step. The output below is generated in detector.c on this line of code.

9798indicates the current training iteration/batch.0.370096is the total loss.0.451929 avgis the average loss error, which should be as low as possible. As a rule of thumb, once this reaches below0.060730 avg, you can stop training.0.001000 raterepresents the current learning rate, as defined in the .cfg file.3.300000 secondsrepresents the total time spent to process this batch.- The
627072 imagesat the end of the line is nothing more than9778 * 64, the total amount of images used during training so far.
Subdivision output
Before we analyze the subdivision output, let's have a look at IOU (Intersection over Union, also known as the Jaccard index) to understand why this is an important parameter to log.
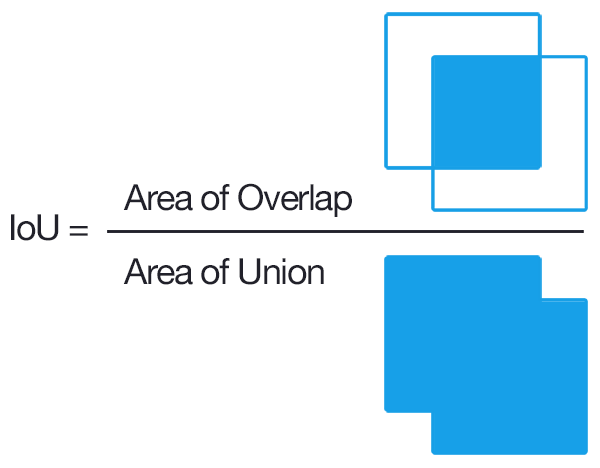
As you can see, IOU is a great metric to determine how accurately our model detected a certain object. At 100% we have a perfect detection: a perfect overlap of our bounding box and the target. It's clear that we want to optimize this parameter.
With that out of the way, time to break down the first line, describing the results for one batch of images. For those that want to delve into the code themselves to verify my claims, this line of code implements how the following line is written.

Region Avg IOU: 0.326577is the average of the IOU of every image in the current subdivision. A 32,66% overlap in this case, this model still requires further training.Class: 0.742537still figuring this outObj: 0.033966still figuring this outNo Obj: 0.000793still figuring this outThe
Avg Recall: 0.12500is defined in code asrecall/count, and thus a metric for how many positives YOLOv2 detected out of the total amount of positives in this subdivision. In this case only one of the eight positives was correctly detected.count: 8is the amount of positives (objects to be detected) present in the current subdivision of images (subdivision with size8in our case). Looking at the other lines in the log, you'll see there are also subdivision that only have6or7positives, indicating there are images in that subdivision that do not contain an object to be detected.
Conclusion
In this short article, we've reviewed the different output parameters YOLOv2 uses to tell us how training is advancing. This is by no means an 'end-all' description, but should hopefully clear up most of the questions you may have when reviewing the training output.
As always, I will gladly accept comments or questions in the comment section to further improve or correct this article. Feel free to comment!